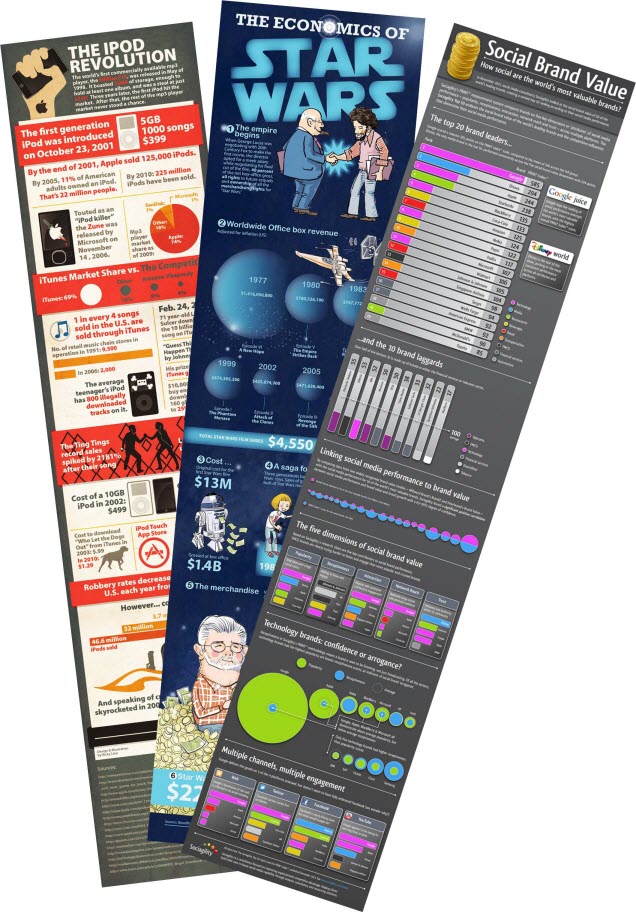
 What is an infographic?
An infographic is “information visualized”. That can mean data and statistics turned into charts and graphs or it can be an idea or story told through images. It’s the use of illustrations to tell a story and make data points easier to understand. Infographics should be visually stimulating while conveying a message or informing the person viewing the infographic. Still not clear? Google Infographics and you’ll see about a billion examples. Also, later in this post, I’ll have some of my own examples and I’ll share with you some of my favorite infographic sites.
What’s the big deal with infographics anyway?
Everyone on the web has attention deficit disorder. Okay, that’s a bit of an exaggeration, but even now, as you’re reading my blog post, you probably want me to hurry up and get to the good part. Maybe you’ve even scanned past most of the article already to scope out the pictures and now you’re back. People like pictures!
There’s so much out there for us to read, we don’t have time for long blog articles (like this one – I’m so impressed you’re still with me!) that when we see an infographic that tells a story with a handful of images, something that is visually interesting, it grabs our attention and if it’s good, keeps our interest.
Easy to share.
You ever read a great article, and want to share it with your friends? You post the link on Facebook or even send them the link via email. Do they read it? Sometimes, sure. But your friends are busy. They see a long article and they add it to their to-do list. They’ll get to it later, right? You know you’ve done that.
But share an infographic with them and they’ll take 60 seconds away from whatever they’re doing to give it a look. They may even take the time to tweet it or pin it. It’s just an infographic after all, not a 500 word article.
Three goals of an infographic
-
Traffic
When you post an infographic on your website or blog, you’re hoping that it’ll bring traffic to the site. Great content means a lot of things on the web, but ideally it means more visitors to your site. You’re a landscaper who posts an infographic about the best plants to use in different regions of the country. It talks about the right plants for the right climates, when they bloom, what shrubs look great together and more. Readers who are working on their landscaping might find this is exactly what they need to make decisions about their own personal landscaping ideas. It may even encourage them to call and hire you to do their landscaping!
-
Links
Google tells us that having backlinks will help us rank higher on their search engine. They also tell us not to actively build links for the purpose of manipulating PageRank and that we should create great content that people will want to link to naturally. A great infographic can act as link bait.
Bloggers and other website owners are hungry for content for their sites. When that tech blogger runs across your awesome infographic that pits the new iPhone against the latest Android, they see something worth sharing with their readers. They will often post the infographic on their site, write a few sentences on their take and usually include a backlink to the original source.
Recently, Matt Cutts, the head of Google’s SPAM team, said that infographic links may get discounted in the future because infographics as link bait is a strategy that has been overused and manipulated. People are building infographics that are misleading and outright wrong. Matt has concerns with how people actively encourage webmasters to link to infographics, even if they are off topic, misleading or simply wrong.
All true. But the same can be said for just about any other content out there. Infographic or article, people create unworthy, thin or incorrect content and then aggressively build links to that content. Google probably won’t (and shouldn’t) discount links coming from great infographics. Their real challenge is the same that they have with any other links – determining which ones are relevant and natural.
-
Social Love
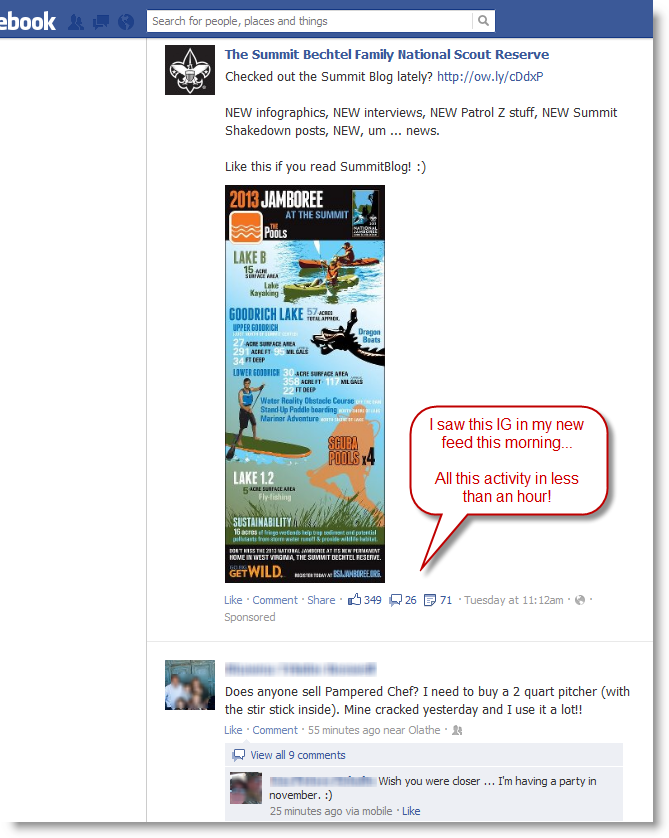
Do you spend any time on Facebook, Twitter or Pinterest? Then you’ve seen infographics come across your news feeds and timelines. Take a look at this occurrence of an infographic built by The Summit Bechtel Scout Reservation in my personal facebook timeline. After being posted for less than an hour, it had 349 likes, 26 comments and 71 shares. Do you think there’s a chance in a million that infographic would have gotten in front of that many eyeballs if it weren’t for facebook? Social media channels are a great way to get your message in front of potential clients.
I won’t even go into how social love helps your site rank higher on the search engines, except to say that it does.


Very interesting. Hearing great things about infographics. One question, do these show up in orgainic searches, like a YouTube video? I haven’t seen one yet.
John, they occasionally show up in “universal search” (That’s the blended search results you sometimes get that include videos, news and images) but it is more common to find them when you search Google Images. In fact, they’re probably not something most people look for, but rather come across while surfing their favorite sites and social networks. Consider an infographic that compares regular deck and concrete staining to the kind of seal you provide. (2 yrs vs 25 yrs) That’s the kind of information that someone writing a home improvement blog would likely want to share with his readers. That’s a more accurate scenario of how someone might find your infographic. But even if they don’t find it, the link from that blog is going to add link juice to your site and help it rank higher for searches for your services.
I completely agree. I think infographics are really great, but only if people see them. I think it is important to choose the right channel when publishing, so that you get really hit your target audience.